Rotate points
This example illustrates how point rotation with geo.rotate.rotate() works.
We define a helper function to plot the points on a globe.
[1]:
def plot_globe(*data, title="", lat_0=-45, lon_0=-40):
    import matplotlib.pyplot as plt
    import numpy as np
    from mpl_toolkits.basemap import Basemap

    map = Basemap(projection="ortho", lat_0=lat_0, lon_0=lon_0, resolution="c")
    map.drawcoastlines(linewidth=0.25)
    map.fillcontinents(color=(0.93, 0.93, 0.93), lake_color=(0.93, 0.93, 0.93))
    map.drawmeridians(np.arange(0, 360, 10), color="gray")
    map.drawparallels(np.arange(-90, 90, 10), color="gray")

    for d in data:
        x, y = d[1], d[0]
        c = None if len(d) < 3 else d[2]
        m = "o" if len(d) < 4 else d[3]
        if c is None:
            c = np.arange(len(x))
        map.scatter(x, y, c=c, marker=m, latlon=True)
    plt.title(title)
    plt.show()
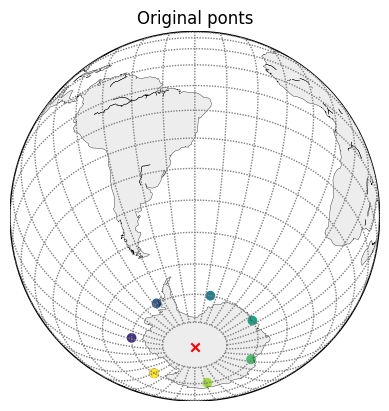
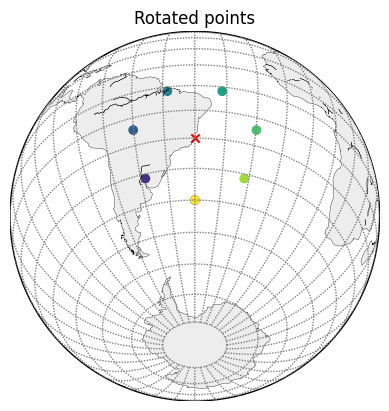
geo.rotate.rotate() performs a spherical rotation. The rotation itself is specified by the rotated position of the south pole. In the example below it is lat=-20, lon=-40.
[2]:
import numpy as np

from earthkit.geo.rotate import rotate

# new position of the south pole, this defines the rotation
south_pole = [-20, -40]

# list of points on the lat=-70 latitude
lat = np.array([-70] * 8)
lon = np.linspace(-180, 180, 8)

# perform rotation
lat_r, lon_r = rotate(lat, lon, south_pole[0], south_pole[1])

# plot the points, red cross marks the south pole
plot_globe([lat, lon], [-90, 0, "r", "x"], title="Original ponts")
plot_globe([lat_r, lon_r], [-20, -40, "r", "x"], title="Rotated points")
[3]:
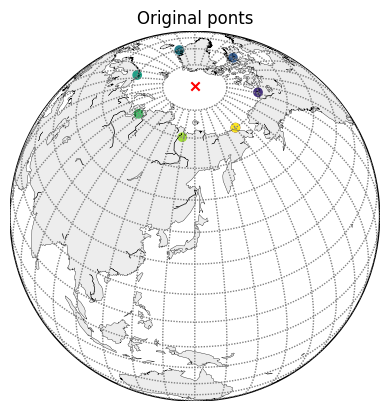
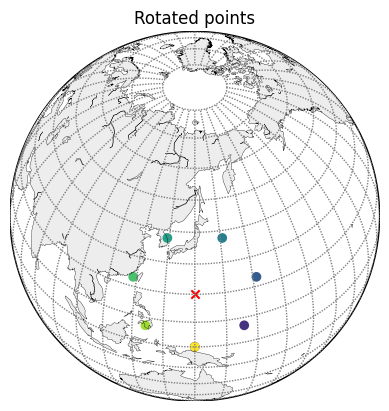
# list of points on the lat=70 latitude
lat = np.array([70] * 8)
lon = np.linspace(-180, 180, 8)

# perform rotation
lat_r, lon_r = rotate(lat, lon, south_pole[0], south_pole[1])

# plot the points, red cross marks the north pole
plot_globe([lat, lon], [90, 0, "r", "x"], title="Original ponts", lat_0=45, lon_0=140)
plot_globe([lat_r, lon_r], [20, 140, "r", "x"], title="Rotated points", lat_0=45, lon_0=140)
[ ]: